For years, analyzing traffic data in Google Search Console (GSC) involved a tedious, manual workflow. You’d check the Performance chart, see a sudden drop or spike on a certain day, and then have to scramble to figure out why. This meant digging through external tools, shared spreadsheets, and old chat logs to find a corresponding change on your site.
This process (trying to perfectly connect a traffic shift with a specific action) was the core problem making SEO analysis messy and time-consuming.
The solution has finally arrived: Custom Annotations. This simple feature provides a clear, built-in, and shared historical record right where you need it most. It allows you to place contextual notes directly on the performance chart.
While GSC has always had “System Annotations” (automatic notes for things like data processing issues), this update introduces Custom Annotations. These are the notes you create yourself, marking important deployments, technical fixes, and content updates. This changes everything about how your team analyzes organic performance.
What Are Custom Annotations in GSC? (A Feature Breakdown)
Custom Annotations are essentially digital sticky notes that live inside your GSC Performance report. They solve the “What happened here?” mystery by providing immediate context for any movement in your Clicks, Impressions, CTR, or Position data.
Key Specifications (The Fine Print):
- Simple Definition: A concise note placed directly on the line chart in your Performance Report.
- Character Limit: You are limited to 120 characters. This is intentional-the note must be clear, brief, and to the point.
- Visibility: Notes are visible to all users (Owners and Full users) who have access to the GSC property. This promotes team coordination and shared context.
- Data Limit: Annotations are temporary and will be automatically removed after 500 days. They are designed for mid-term reference and impact analysis.
Annotations turn raw data movement (a line going up or down) into a contextual narrative. You no longer have to guess what action led to what result.
Step-by-Step: How to Add Your First Custom Note
Adding a custom annotation is quick and intuitive, designed to fit seamlessly into your existing workflow.
Where to Go
The feature is located exclusively within the Performance Report in GSC. This is the main dashboard for tracking your Clicks, Impressions, CTR, and Position data.
The Quickest Method (Right-Click)
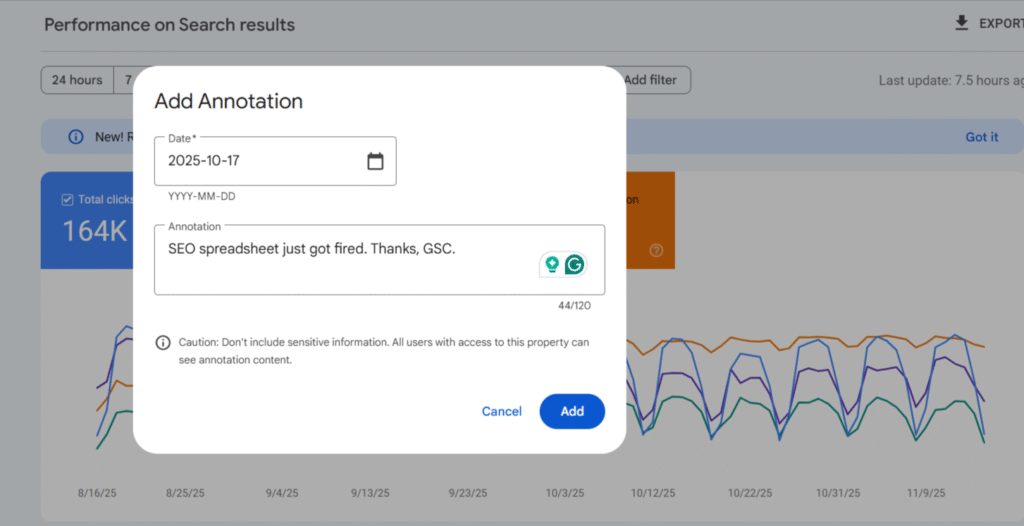
The fastest way to place a note is to right-click directly on the specific point (or date) on the Performance chart where the action or event occurred. This action immediately brings up the annotation dialogue box pre-filled with the date.
The Input Process
- Confirm Date: If you used the right-click method, the date will be selected.
- Write the Note: Enter your clear, concise description (remember the 120-character limit).
- Save: Click “Add” or “Save” to place the note.
Visualizing the Note
Once saved, the note appears as a simple marker (a small dot or pin) located directly below the chart timeline. When you or a team member hover over the marker, the full note text appears as a tooltip, providing instant context for that specific day’s data.
5 Strategic Ways to Use GSC Annotations for Maximum Impact
To maximize the value of this feature, stop documenting general activity and start using annotations strategically to prove cause and effect.
Tracking Technical Improvements
Mark the exact day a technical task was deployed to create a clean baseline for measuring the result.
- Example Annotations: Fixed broken canonical tags site-wide. Checking indexing in 7 days. or Mobile speed optimization complete (LCP improved by 0.5s).
Content Performance Analysis
Documenting content changes helps you isolate whether an update led to a rank or traffic change, proving the value of content investment.
- Example Annotations: Updated 15 core service pages for topic cluster 3. or Rewrote H1/Meta for high-impression, low-CTR pages.
Major Site Events
For high-stakes projects, the annotation serves as a crucial point of reference for all follow-up analysis.
- Example Annotations: Full site migration deployed. Checking GSC indexation report. or Launched new ‘Product Widget’ category.
External and Team Communication
Use these notes to communicate shared context across your team, especially when multiple people work on the same property.
- Example Annotations: [Team Alpha] Backlink manual audit completed. or National holiday promotion begins (Seasonal traffic shift expected).
Responding to Google Updates
When a Core Update is confirmed, drop a marker immediately. This allows you to create a crystal-clear “before and after” snapshot, making it easier to filter your data and assess the full impact over the following weeks.
- Example Annotation: Google Core Update confirmed. Monitoring volatility.
Conclusion: Making Data Attribution Intuitive
The introduction of Custom Annotations in GSC closes one of the largest attribution gaps in organic reporting. It means less time spent searching through spreadsheets and more time spent analyzing why your actions led to a specific result.
This is more than a quality-of-life feature; it’s an essential tool that formalizes your team’s SEO history right next to your most critical search data.
Next Steps: Stop what you’re doing and open your GSC Performance report. Start documenting those changes immediately, ensuring a clean, accurate historical record moving forward.
Discussion Prompt: What is your team’s preferred convention for annotating a major algorithm update versus a site deployment?

